How To Catch A 5x, Using Ancient Math To Trade Memes
- Spot Socials
- Jul 30
- 5 min read

Updated: Jul 31
Written by Jason Krutzky, Chartered Meme Technician at Spot Trading.
Hey there, Gang!
If you watch my X feed, or read these notes regularly, you know that I've had my eye on $URANUS for the past few weeks and when it ripped this past weekend, I was all over it.
In this note, I'm going to teach you about the tool I used to help me spot the move before it happened and how to catch a 5x!
Let's dig in.
❓ WTF Is Fibonacci
The tool I used is called the Fibonacci measuring tool. I know what you're probably thinking... 'Fibba what?'
The Fibonacci measuring tool, or Fibs as I like to call them, serve two distinct purposes in my analysis. They help me identify:
Where price should bounce when its going down
Where price should stop when its going up
Sounds pretty handy, huh? I assure you, it is.
But before I get into how I used the Fib measuring tool on $URANUS, let's have a super quick history lesson about its creator.
Fibonacci was an Italian mathematician from 800 years ago who discovered a numerical sequence that shows up everywhere in nature - from flower petals to seashells.
His 'Golden Ratio' is visualized in the below schematic. I have a feeling you've at least seen this before.

While the sequence itself is inconsequential for us, over time, traders and analysts have discovered that the ratios derived from it - particularly 23.6%, 38.2%, 50%, 61.8%, and 78.6% - seem to appear frequently in financial markets.
For us traders, these ratios translate as horizontal levels that get overlaid on the price chart, measuring the distance between key highs and lows.
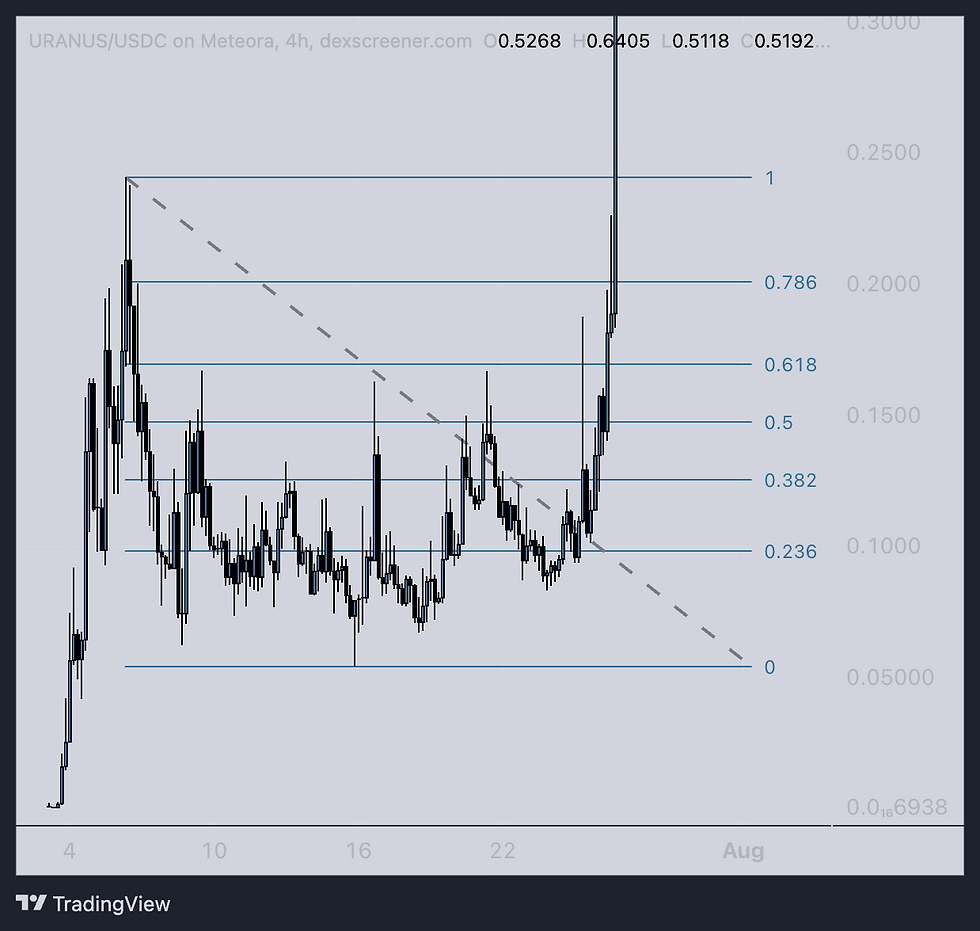
I know, it sounds crazy, but just look at this picture of the $URANUS chart below. Nearly every time price stops and reverses, it does so at a Fib level.
🍋 Anatomy Of A Breakout: How To Catch A 5x
Now that you have a basic visual understanding of how the Fib ratios get overlaid as levels on a price chart, let's talk about the analysis I did that helped me understand that $URANUS was about to moon.
There were a few key tells.
First, when price is going sideways, like it was on $URANUS for the three weeks leading up to the big breakout this past weekend, we call it a 'consolidation' phase.
In a consolidation phase, price stays in a tight range, bouncing between the Fib levels. As price tightens, or the distance between short term highs and lows decreases, the odds of a breakout increase.
This was the first tell. A very clean consolidation period in the lower half of the Fib sequence (below the 50% level).
Every time price tried to push past the 50% level, it got rejected (visualized by the wicks of the candles that are circled below).

Seeing this, I knew that if price could just get above that 50% level with some power, it would likely breakout.
Another key tell was the higher highs and higher lows that began to form. They're subtle, and frankly, easy to miss, but they're there, and they were a sign that the downtrend was beginning to reverse.

Once that 50% Fib level was gained with power, it was game on.
Price started pushing powerfully higher and was now in what we call 'discovery' mode.
Discovery mode occurs when price is at all-time highs. At all-time highs, there's no previous price history at those levels, which means there's no real way to gauge when price might stop moving higher.
Luckily, we have Fibs to help us.
Just as we can measure Fib levels within a high and low, we can also measure Fib levels from a high to low. We call these 'extensions'.
To get these extensions, simply add a whole number to the front of the percentage ratio. For instance, a 0.618 extension can be 1.618 or 2.618 or 3.618, and so on.
When we add Fib extensions onto the chart, we see that price continues to respect various levels.

The first daily candle out of the consolidation period stalled right at the 2, or 200% extension, while day two of the move took it to the 4.236% extension before closing just below the 2.5.
Additionally, the 2x extension that initially acted as resistance on the first day of the move has been acting as perfect support for the past two sessions.
Moreover, If you switch to a lower time frame chart, in this case, the one hour chart, you'll see that other Fib levels have in fact played a huge role in shaping the movements of price.

Price initially rejects off the 1.618 and the 2x fib extensions. It then finds support at the 1.618 briefly before a push higher to the 3.618 and ultimately past the 4x to the 4.236.
Currently, it's in another consolidation phase, stuck between the 2x and 3x Fib extensions.
These are very clean movements that are highly tradable if you know how to find them, and now you do!
🧳 The Takeaway
Where you get in on this trade depends on your risk tolerance. For those with the biggest risk threshold, getting in when the higher highs and higher lows started to form was the best trade in terms of return. That's when I started accumulating, between $12.5m - $15m market cap.
From there to the highs at $81m, it was over a 5x!
For those who are looking for more confirmation and a little bit safer of a bet, waiting for price to close above that 50% level, between the .618 and .786 Fib levels (around a $18-20m market cap), was another place to initiate a position.
If you zoom in, you can see they gave a very clear signal with a powerful candle through the .5 level just before the big breakout occurred.

Once that 50% level was gained, I expected price to at least test the all-time high ($26m market cap). Once price made a new all-time high, it was in price discovery and the Fib extensions became my guide!
Now I know you're probably thinking; This is all great, but the move already happened and I missed it. What's the next play like this?
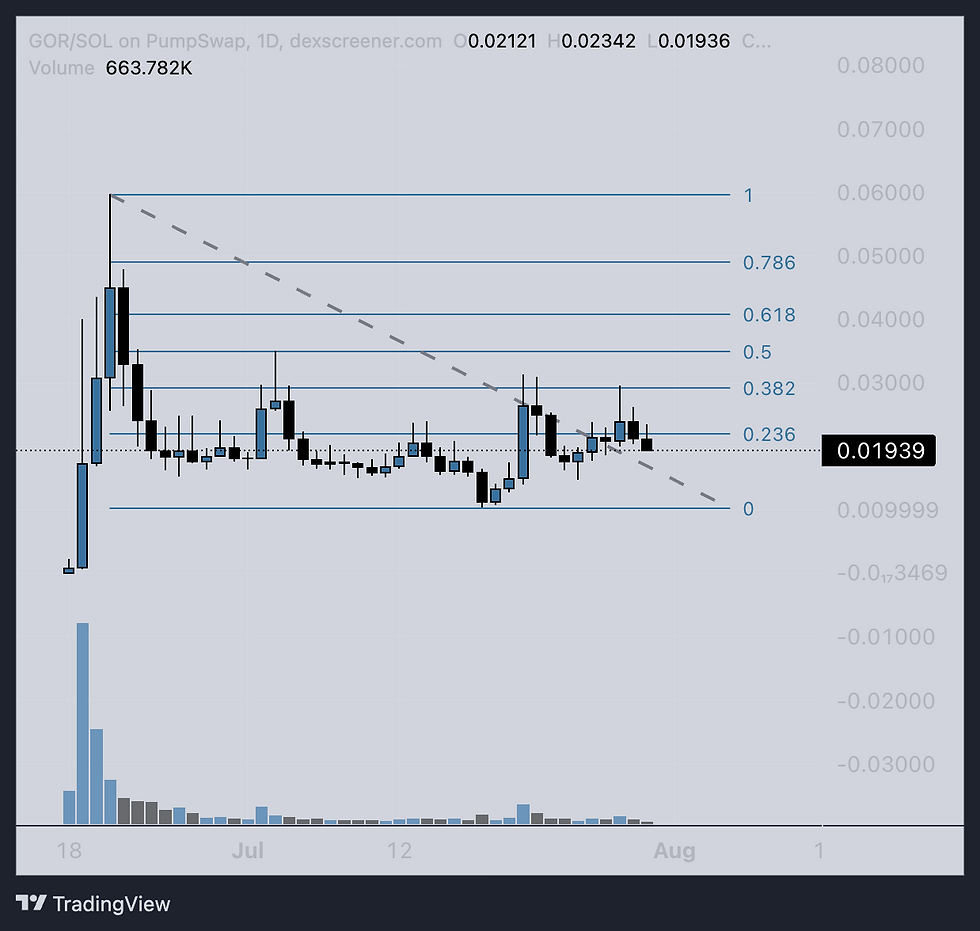
Well, personally, I have my eye on $GOR, but its not quite ready yet. I'll be watching this one closely, though, and will let you guys know if I see something taking shape!
What names are you watching? Shoot me an email at Jasonk@spot.dog and let me know!

Comments